How to Quantify Achievements on Your Resume
Quantify achievements by adding specific numbers to every bullet point: percentages (grew sales 35%), dollar amounts (managed $2M budget), volume (resolved 75 tickets daily), time savings (cut process from 2 weeks to 3 days), team size (led team of 12), or rankings (#1 in region). If you don’t have exact data, use honest estimates with ranges or approximations.
Which of these catches your attention?
If your own numbers aren’t landing, get your resume roasted to see which bullets still read as vague.
“Improved customer satisfaction”
or
“Increased customer satisfaction scores from 72% to 94% in 6 months”
The second one. Every time. Numbers transform vague claims into memorable proof — and resumes with quantified achievements get 40% more interview callbacks.
More interviews
Resumes with quantified achievements performed markedly better across an analysis of 6,348 applications
Source: TalentWorks, via ERE (2019)
Yet most resumes are filled with weak, unquantified statements like “handled customer accounts” and “improved processes.” These blend into the background. Numbers stand out. (For more on this distinction, see our guide on achievements vs responsibilities.)
This guide shows you exactly how to add metrics to every type of achievement—even when you don’t have exact data.
What You'll Learn
- The 6 types of metrics you can use on any resume
- How to estimate numbers (honestly) when you don’t have exact data
- 30+ before/after examples across industries
- Where to place metrics for maximum impact
- Common mistakes that weaken your quantification
Why Numbers Work
Recruiters scan hundreds of resumes. They’re looking for proof you can do the job.
Quantified Achievements ✅
- Instantly credible — numbers feel objective
- Memorable — specific figures stick in minds
- Comparable — easy to benchmark against others
- Show impact — prove you delivered results
- ATS-friendly — metrics often match job requirements
Vague Statements ❌
- Forgettable — blend into the background
- Questionable — claims without proof
- Unmeasurable — no way to gauge impact
- Sound like job descriptions — not achievements
- Miss keyword opportunities
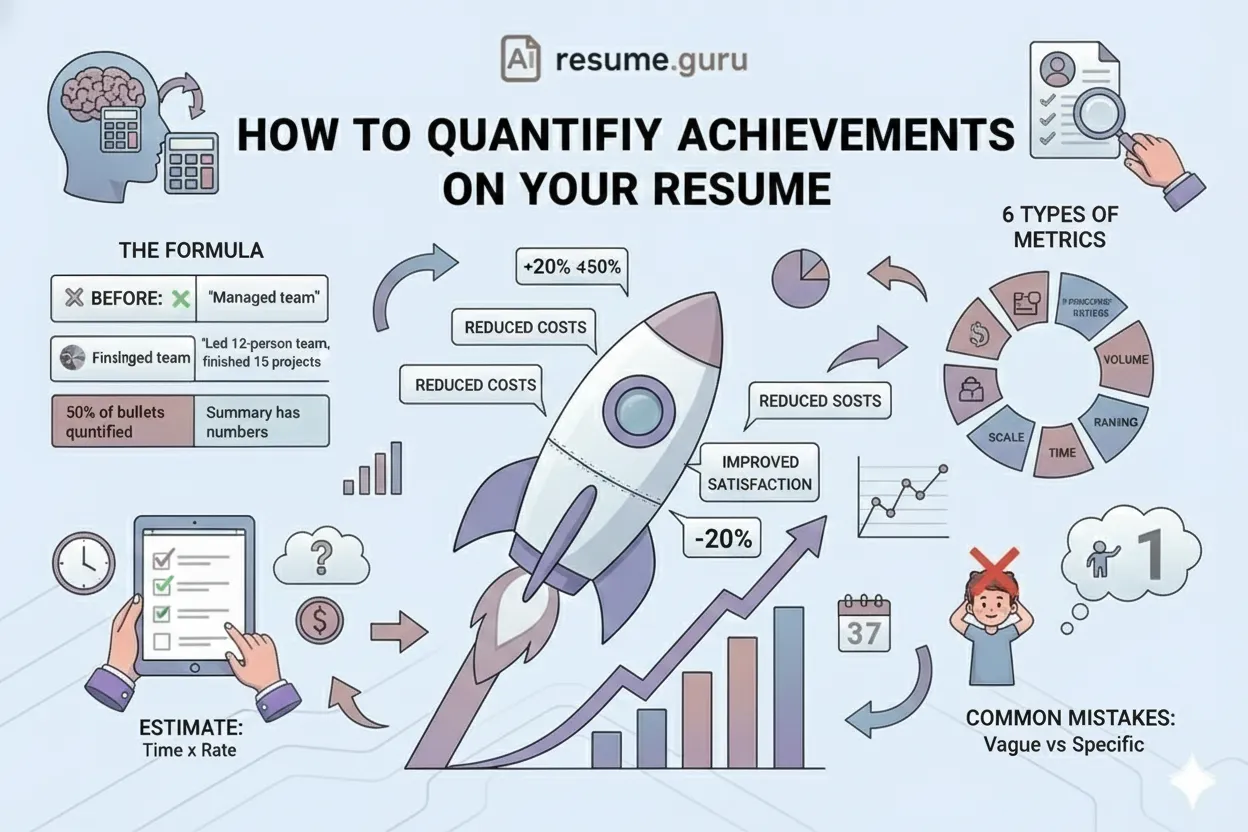
The 6 Types of Quantification
Almost everything can be quantified. Here’s your framework:
Scope counts as quantification too, which is part of why job titles on resume carry so much weight.
- 1
Percentages
'Increased sales by 35%' — Shows relative improvement. Great for growth, efficiency gains, and before/after comparisons.
- 2
Dollar Amounts
'Managed $2M budget' — Shows scope and financial impact. Use for revenue, savings, budgets, and deal sizes.
- 3
Volume/Frequency
'Resolved 60 tickets daily' — Shows workload and capacity. Perfect for repetitive tasks and throughput.
- 4
Time Savings
'Reduced process time from 2 weeks to 3 days' — Shows efficiency gains. Powerful for process improvements.
- 5
Team/Scale
'Led team of 12' — Shows leadership scope. Include team sizes, account numbers, user counts.
- 6
Rankings/Comparisons
'Ranked #1 in region' — Shows competitive excellence. Use percentiles, awards, and benchmarks.
How to Quantify When You Don’t Have Exact Data
The most common excuse: “I don’t know the exact numbers.”
Here’s the truth: you can almost always estimate. And reasonable estimates are far better than no numbers at all.
Estimation Techniques
| You Don't Know... | How to Estimate |
|---|---|
| Exact volume | Count for one day/week, then multiply |
| Precise percentage | Compare before and after, even roughly |
| Dollar impact | Calculate time saved × hourly rate |
| Team contribution | Estimate your percentage of team output |
| Any metric | Use ranges: '50-75 daily' or 'approximately 30%' |
Honest Estimation Is Fine
Use qualifier words when estimating:
- “Approximately…”
- “~50 daily”
- “An estimated 30%”
- “50-75 tickets per day”
As long as you’re not lying, estimates are acceptable—and expected.
Questions to Uncover Numbers
Ask yourself:
- How many? (customers, projects, transactions, reports)
- How often? (daily, weekly, monthly)
- How much? (dollars, hours, percentage)
- How big? (team size, budget, reach)
- Compared to what? (average, previous period, target)
30+ Before/After Examples
Sales & Business Development
| Before ❌ | After ✅ |
|---|---|
| Exceeded sales targets | Exceeded quarterly quota by 145%, generating $2.1M in new revenue |
| Managed key accounts | Managed portfolio of 50+ enterprise accounts totaling $8M ARR |
| Increased sales | Grew territory sales 35% YoY, adding $500K in new business |
| Good at closing deals | Maintained 40% close rate (15% above team average) |
Marketing & Communications
| Before ❌ | After ✅ |
|---|---|
| Grew social media presence | Increased Instagram following from 5K to 50K (+900%) in 8 months |
| Managed email campaigns | Achieved 32% email open rate (2x industry average) across 50K subscribers |
| Improved website traffic | Grew organic traffic from 20K to 100K monthly visitors through SEO |
| Created content | Produced 80+ blog posts generating 500K+ pageviews annually |
Technology & Engineering
| Before ❌ | After ✅ |
|---|---|
| Improved system performance | Reduced API response time by 65% through query optimization |
| Fixed bugs | Resolved 200+ production issues with median resolution time of 2 hours |
| Built features | Developed payment module processing $2M+ in monthly transactions |
| Wrote code | Authored 15K lines of code across 3 microservices serving 1M+ users |
Finance & Accounting
| Before ❌ | After ✅ |
|---|---|
| Managed budgets | Managed $5M departmental budget with 100% compliance for 3 years |
| Reduced costs | Identified $300K in annual savings through vendor renegotiation |
| Prepared reports | Delivered 50+ financial reports to C-suite with zero restatements |
| Improved collections | Reduced accounts receivable aging from 45 days to 28 days |
Customer Service & Support
| Before ❌ | After ✅ |
|---|---|
| Handled customer inquiries | Resolved 75+ customer tickets daily with 98% satisfaction rating |
| Improved satisfaction | Increased NPS from 32 to 58 through redesigned feedback process |
| Trained new employees | Onboarded 15 new support agents, reducing ramp time by 40% |
| Reduced complaints | Decreased escalations by 35% through first-call resolution training |
Project Management
| Before ❌ | After ✅ |
|---|---|
| Delivered projects successfully | Delivered 15 projects on time and under budget, totaling $4M value |
| Led cross-functional teams | Coordinated 25+ stakeholders across 4 departments and 3 time zones |
| Improved efficiency | Reduced project delivery time by 30% through Agile implementation |
| Managed vendors | Negotiated vendor contracts saving $200K over 2-year period |
Human Resources
| Before ❌ | After ✅ |
|---|---|
| Recruited employees | Filled 60 positions in 12 months with average time-to-hire of 25 days |
| Reduced turnover | Decreased voluntary turnover from 25% to 12% through engagement initiatives |
| Conducted interviews | Screened 500+ candidates with 85% offer acceptance rate |
| Improved onboarding | Redesigned onboarding program, improving 90-day retention by 40% |
Content Writing & Copywriting
| Before ❌ | After ✅ |
|---|---|
| Wrote blog posts for company website | Published 80+ SEO-optimised articles driving 50K monthly organic visitors |
| Managed email newsletter | Wrote weekly newsletter to 25K subscribers, achieving 32% average open rate (2x industry benchmark) |
| Created social media content | Produced 200+ social posts generating 500K+ impressions and 15K engagements quarterly |
| Improved SEO rankings | Ranked 15 articles on Google page 1, increasing organic traffic by 180% in 6 months |
| Edited content for the team | Edited and quality-checked 40+ articles monthly, maintaining 98% first-pass approval rate |
Data Science & Analytics
| Before ❌ | After ✅ |
|---|---|
| Analysed data for business insights | Analysed 500K+ customer records, identifying 3 segments that drove 60% of revenue |
| Built dashboards | Created 10 Tableau dashboards used by 50+ stakeholders for daily decision-making |
| Improved forecasting accuracy | Reduced demand forecast error from 25% to 8% using gradient boosting models |
| Automated reporting | Automated weekly reporting pipeline, saving finance team 20 hours per week |
| Worked with machine learning models | Deployed churn prediction model with 89% accuracy, retaining $1.2M in at-risk accounts |
Need help turning your vague bullets into quantified statements? Our AI Bullet Point Generator does this automatically — describe what you did and it writes the achievement-focused, quantified version.
Where to Put Metrics
Not all placements are equal:
| Location | Priority | Example |
|---|---|---|
| Experience bullets | 🔴 Critical | Led initiative that reduced costs by 25% |
| Professional summary | 🔴 Critical | 8+ years driving $10M+ in annual revenue |
| Project descriptions | 🟠 High | Built app serving 50K daily users |
| Skills section | 🟡 Medium | SQL (5+ years, 100K+ queries optimized) |
Tip
Put your most impressive metric in your professional summary — it’s the first thing recruiters read. Use a strong action verb to lead each bullet.
Common Quantification Mistakes
Cramming numbers into a cramped layout is its own mistake — browse ATS-safe templates that give bullets room.
Mistake 1: No Quantification At All
“Improved customer satisfaction” tells nothing. How much? From what to what?
Fix: Add a number, even if estimated: “Improved customer satisfaction scores by ~20%”
Mistake 2: Vague Quantification
“Handled many customer accounts” — how many is “many”?
Fix: Be specific: “Managed 50+ customer accounts” or “Managed portfolio of 30-40 accounts”
Mistake 3: Irrelevant Metrics
“Attended 50+ meetings” — so did everyone. That’s not an achievement.
Fix: Focus on outcomes: “Facilitated 50+ client meetings resulting in 15 new contracts”
Mistake 4: Missing Context
“Increased revenue by 10%” — is that good? Depends on the context.
Fix: Add context: “Increased revenue by 10% (2x team average)” or “in declining market”
The Quantification Formula
The Formula
[Action Verb] + [What You Did] + [Quantified Result]
Optional: Add context (vs. target, vs. average, timeframe)
Examples:
- Reduced customer churn by 25% (quantified result) by implementing proactive outreach program (what you did)
- Managed (action verb) $3M marketing budget (quantified scope) with 100% on-time delivery (quantified result)
Quick Reference Checklist
Quantification Checklist
- At least 50% of bullets include a metric
- Most impressive achievement is in your summary
- Using variety: percentages, dollars, volume, time
- Estimates are reasonable and honest
- Metrics show outcomes, not just activity
- Context provided where helpful (vs. target, vs. average)
The Bottom Line
Numbers are the difference between a forgettable resume and one that lands interviews. Every achievement can be quantified — frequency, volume, dollars, time, scope, or comparison. If you don’t have exact data, estimate honestly.
Once you’ve quantified your bullets, make sure the rest of your resume supports them: ATS-friendly formatting, the right industry keywords, and proper bullet point length (1-2 lines each). Use our Keyword Scanner to check if your quantified achievements match what employers are looking for.
For entry-level candidates with limited metrics to cite, see our guides on volunteer work and personal projects — both can be quantified using the same techniques.
Turn vague bullets into quantified achievements
Our AI Bullet Point Generator transforms 'managed accounts' into 'managed portfolio of 50+ accounts totaling $8M ARR' — automatically. Free, no signup.
Try Bullet Point Generator FreeRelated Resources
- Resume Bullet Point Length — Ideal length for quantified bullets
- Action Verbs for Resume — Pair strong verbs with your metrics
- Achievements vs Responsibilities — Why achievements win every time
- Resume Summary vs Objective — Where to put your top metric
- ATS Keywords by Industry — Keywords that match your metrics
- Entry-Level Resume Guide — Quantifying limited experience
- Volunteer Work on Resume — Quantify volunteer impact too
- Bullet Point Generator — AI writes quantified bullets for you
- Keyword Scanner — Check if your metrics match the job
- Resume Templates — Professional formats for your achievements
Frequently Asked Questions
Why should I quantify achievements on my resume?
Numbers are concrete, memorable, and provable. '35% increase' sticks in a recruiter's mind; 'significant improvement' doesn't. Quantified achievements show impact, not just activity.
What if I don't know the exact numbers?
Estimate. Use ranges. Approximate. 'Resolved ~50 tickets daily' is far better than 'handled customer inquiries.' Reasonable estimates are fine—just don't lie.
What can I quantify if my job wasn't numbers-focused?
Everything has a number: frequency (daily, weekly), volume (how many), time (hours saved), scope (team size, budget), ratings (satisfaction scores), and comparisons (% above average).
How many achievements should have numbers?
As many as possible—aim for at least 50% of your bullets to include a metric. Your most impressive achievements should always be quantified.
Is it okay to estimate metrics on my resume?
Yes, as long as estimates are reasonable and honest. Use words like 'approximately,' '~' or ranges like '50-75' if you're not certain of exact figures.
How do I quantify achievements as a content writer?
Content writers can quantify: articles published (80+ posts), traffic driven (50K monthly visitors), engagement metrics (32% email open rate), SEO rankings (15 first-page keywords), and conversion impact (3x lead generation from blog content).
How do I quantify achievements as a data analyst?
Data analysts can quantify: datasets processed (analysed 500K+ records), time savings (automated reports saving 20 hours/week), business impact ($200K cost reduction from insights), accuracy improvements (reduced forecast error by 15%), and stakeholder reach (delivered dashboards to 50+ users).
What's the difference between achievements and responsibilities on a resume?
Responsibilities describe what you were supposed to do ('managed social media accounts'). Achievements describe what you actually accomplished ('grew social media following by 300%, driving $50K in attributed revenue'). Always lead with achievements.
Put this into practice
You have the theory. These take a few minutes and work on the resume you already have.